timeseries-qc
The open source data quality-control layer for SCADA, DCS, IoT, and historian time-series data.
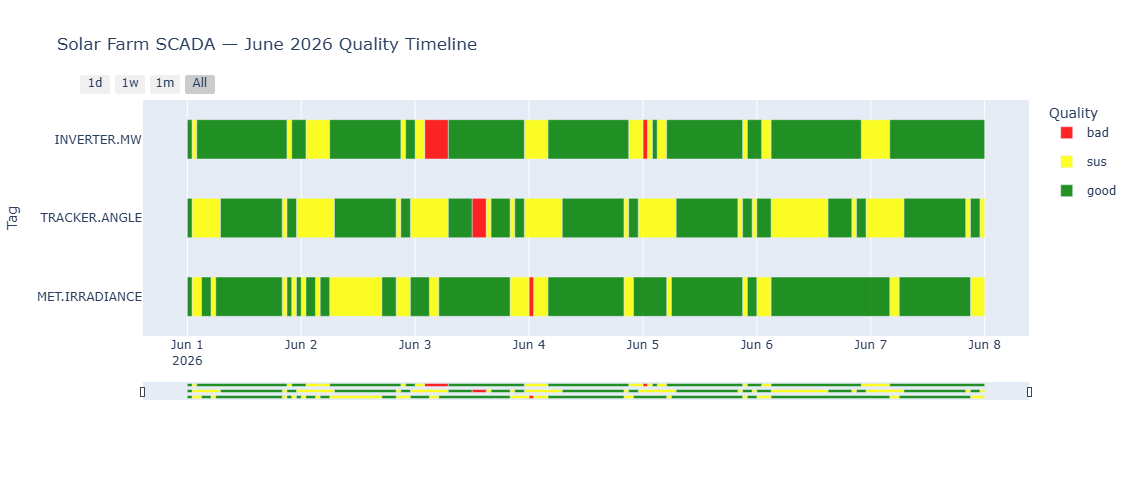
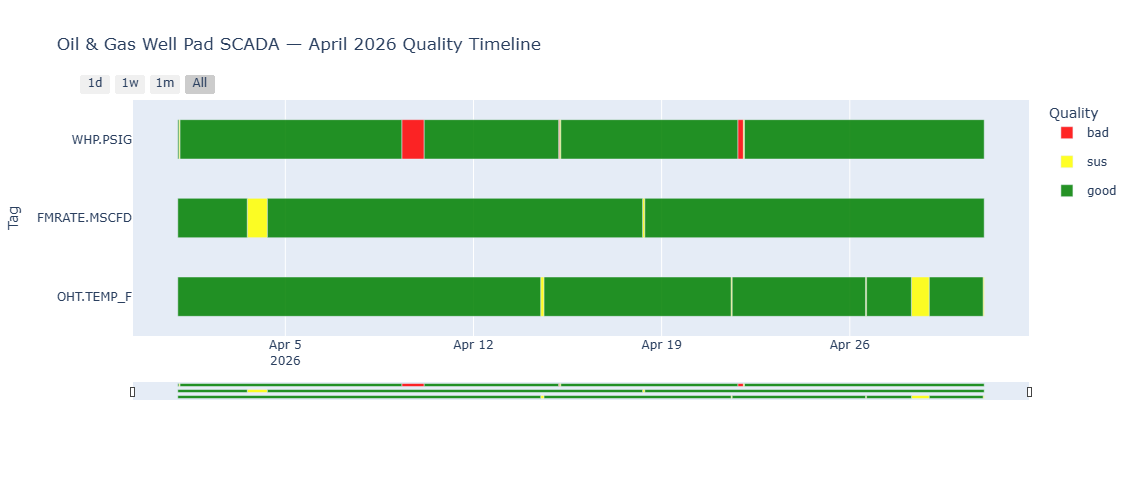
Add good / suspect / bad quality labels to every row of a pandas DataFrame in five lines. Then render a multi-tag horizontal status timeline — the chart that no other open-source library produces.


![]()

Quickstart
import tsqc
import pandas as pd

df = pd.read_csv("sensor_data.csv")          # columns: timestamp, tag_name, value
result = tsqc.check(df, assume_tz="UTC")     # assume_tz required for tz-naive CSVs
result.plot().show()                          # renders the multi-tag quality timeline
That's the entire API. check() returns a QCResult with all downstream methods.
Get Started → Installation Guide → View on GitHub →
Features
Built-in Rules
Null, Flatline, Delta, and Range rules cover the majority of real-world sensor faults. Custom rules accept any callable.
Timeline Chart
Plotly horizontal Gantt chart with one row per tag, color-coded by quality, interactive hover, and range selector.
External Quality Column
Use a pre-existing historian quality column exclusively or merged with internal rules. Supports exclusive/combined/none modes.
Timestamp Health
Detects gaps, duplicates, non-monotonic timestamps, frequency drift, and DST ambiguities.
YAML Configuration
Write rules in a plain text file. No Python required. Glob patterns supported for tag matching.
Offline HTML Report
Self-contained export with embedded Plotly chart, summary tables, and per-issue breakdown. No CDN needed.
Pandas Native
Works with any DataFrame containing timestamp, tag_name, and value columns. Single-tag mode supported.
Quality Labels
● good ● suspect ● bad
When multiple rules fire, the worst level wins: bad > sus > good. Triggered rule names appear in a pipe-delimited quality_reasons column.
Example Output
Input & Output
Input
| Column | Type | Notes |
|---|---|---|
timestamp | datetime | UTC-aware or tz-naive (pass assume_tz) |
tag_name | str | Sensor identifier. Omit column or pass tag_col=None for single-tag mode. |
value | float | The measurement to check. |
Output
result.df adds two columns to the original DataFrame:
| Column | Values | Notes |
|---|---|---|
quality | "good", "sus", "bad" | Worst-level rule wins |
quality_reasons | e.g. "flatline\|range" | Pipe-delimited triggered rule names |
YAML Config
# tsqc_rules.yaml
default_rules:
  - check: null
    level: bad
  - check: flatline
    window: 1h
    min_delta: 0.001
    level: sus
  - check: delta
    max_delta: 50.0
    level: sus

tag_rules:
  "FOREBAY.LEVEL":
    - check: range
      min: 900
      max: 1100
      level: bad
  "GENERATOR.*":
    - check: range
      min: 0
      max: 200
      level: bad
    - check: flatline
      window: 30min
      min_delta: 0.5
      level: sus
result = tsqc.check(df, rules="tsqc_rules.yaml")
result.summary()           # DataFrame: pct_good/sus/bad per tag
result.issue_summary()     # DataFrame: per-issue runs (start, end, rows, duration, reasons)
result.check_timestamps()  # DataFrame: gap/duplicate/non_monotonic issues
result.export_report("report.html")  # Full HTML with chart + all tables
External Quality Column (v0.4.0)
Use a pre-existing quality/status column from your SCADA historian alongside or instead of internal rules:
| Mode | Behavior |
|---|---|
exclusive | External quality only; no internal rules run |
combined | External + internal merged (worst-wins: bad > sus > good) |
none | Internal only; ignores external column (escape hatch) |
result = tsqc.check(df, external_quality_col="status", quality_mode="combined",
                     quality_map={0: "good", 1: "sus", 2: "bad"}, assume_tz="UTC")
See the User Guide for full details.
Comparison with Alternatives
| timeseries-qc | Pecos | SaQC | Great Expectations | |
|---|---|---|---|---|
| Classification | Good / Sus / Bad | Pass / Fail | Flags | Pass / Fail |
| Timeline chart | Yes | No | No | No |
| YAML config | Yes | No | JSON | No |
| Time-series native | Yes | Yes | Yes | No |
| License | MIT | BSD-3 | LGPL | Apache-2.0 |
Pecos (Sandia Labs) offers binary pass/fail and has been in maintenance mode since 2021 — no timeline chart and no YAML config.
SaQC (Helmholtz UFZ) is a rich flagging engine for environmental science but has an environmental-domain API, no timeline visualization, and an LGPL license.
Great Expectations is not timeseries-native and produces no visualization.
timeseries-qc is the only library that combines (1) Good/Sus/Bad classification, (2) the multi-tag horizontal status timeline, and (3) YAML-driven configuration in a single pip install.
Known Limitations (v0.4.0)
- Pandas only. PySpark and Polars support are planned.
- No YAML override of default rules. Tag-specific rules add to, not replace, default rules.
- Visualization requires Plotly ≥ 5.0. Matplotlib output is not yet supported.
Next Steps
System requirements, pip install, and dev setup.
Run your first quality check in 5 lines.
Full documentation for every function and method.
Source code, issues, and contributions.