Duval's Triangle Plotter
Python library for generating Duval's Triangle plots — a ternary diagnostic tool used in Dissolved Gas Analysis (DGA) for power transformer condition monitoring.


What is Duval's Triangle?
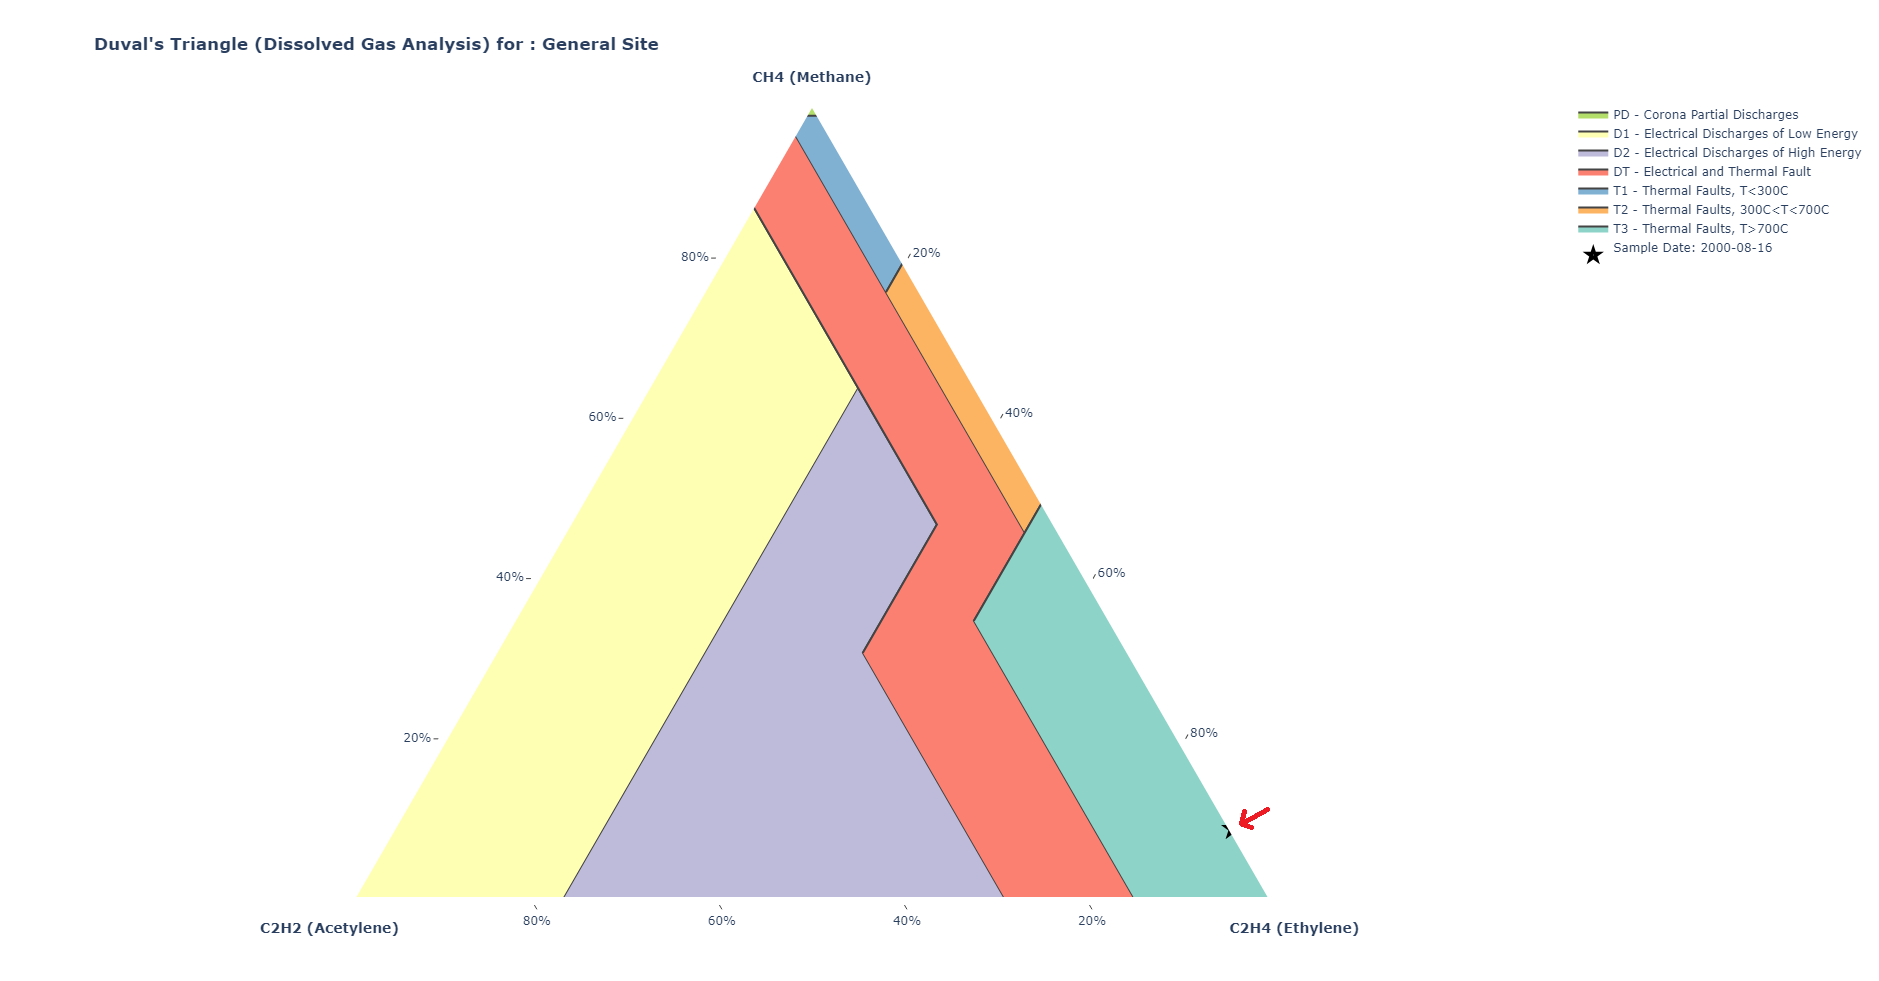
Duval's Triangle is a ternary plot that visualises the relative concentrations of methane (CH4), acetylene (C2H2), and ethylene (C2H4) dissolved in transformer oil. Different regions of the triangle correspond to distinct fault types, making it a standard diagnostic tool in power transformer condition monitoring.
Why use this library?
Manually plotting Duval's Triangle requires careful calculation of gas ratios and region boundaries. This library automates the entire process: provide gas concentrations and receive a publication-ready, interactive Plotly figure with all seven fault regions shaded and labelled.
- Ternary Plots — Generate publication-ready Duval's Triangle plots from gas concentration data.
- Fault Regions — Seven standard zones: PD, D1, D2, DT, T1, T2, and T3, each with a distinct colour.
- Customisable — Adjust layout dimensions, axis titles, marker symbols, and equipment labels.
- Plotly Backend — Built on Plotly — interactive, zoomable figures that render in Jupyter notebooks and browsers.
Installation
Quick Start
import duvals_triangle_plotter as dtp

# concentrations in ppm
methane   = [0.09]
acetylene = [0.0]
ethylene  = [0.91]
date      = "2000-08-16"

trace = dtp.get_duval_points_traces(
    methane, acetylene, ethylene, date
)

fig = dtp.get_duvals_triangle_plot(
    [trace], show_plot=True
)
Documentation
- Installation — pip instructions, dependencies, Python version support
- Quick Start — minimal working example with input and output explanation
- API Reference — complete function documentation
- Fault Regions — detailed explanation of the seven fault types
- Duval's Triangle Explained — in-depth guide to the method
- Examples — code snippets for common use cases
- FAQ — answers to common questions
Frequently Asked Questions
What is Duval's Triangle?
Duval's Triangle is a graphical method for interpreting Dissolved Gas Analysis (DGA) data. It plots three hydrocarbon gases (methane, acetylene, ethylene) as percentages on a ternary diagram and identifies fault types based on which region the data point falls in.
How do I install this library?
Run pip install duvals-triangle-plotter. Requires Python 3.6+ and Plotly 5+. See the Installation page for details.
What inputs does the library expect?
Three lists of gas concentrations (methane, acetylene, ethylene) in ppm, plus a date or label string for each sample.