Visualizing Transformer Health with Duval's Triangle Plotter
TLDR: https://pypi.org/project/duvals-triangle-plotter/
Introduction
Transformers are a critical part of our electrical infrastructure, powering homes, industries, and businesses worldwide. Monitoring their health is essential to prevent outages, reduce maintenance costs, and ensure reliable power delivery. One widely used method for transformer diagnostics is Duval’s Triangle, a graphical approach for analyzing dissolved gas concentrations in transformer oil.
To make this analysis more accessible and efficient, I created the Duval’s Triangle Plotter, an open-source Python-based tool for plotting and interpreting Duval’s Triangle. This project simplifies a complex task and provides engineers and researchers with a powerful visualization tool.
What is Duval’s Triangle?
Duval’s Triangle is a diagnostic tool that classifies faults in transformers based on the concentrations of three gases dissolved in transformer oil:
- Methane (CH₄)
- Ethylene (C₂H₄)
- Acetylene (C₂H₂)
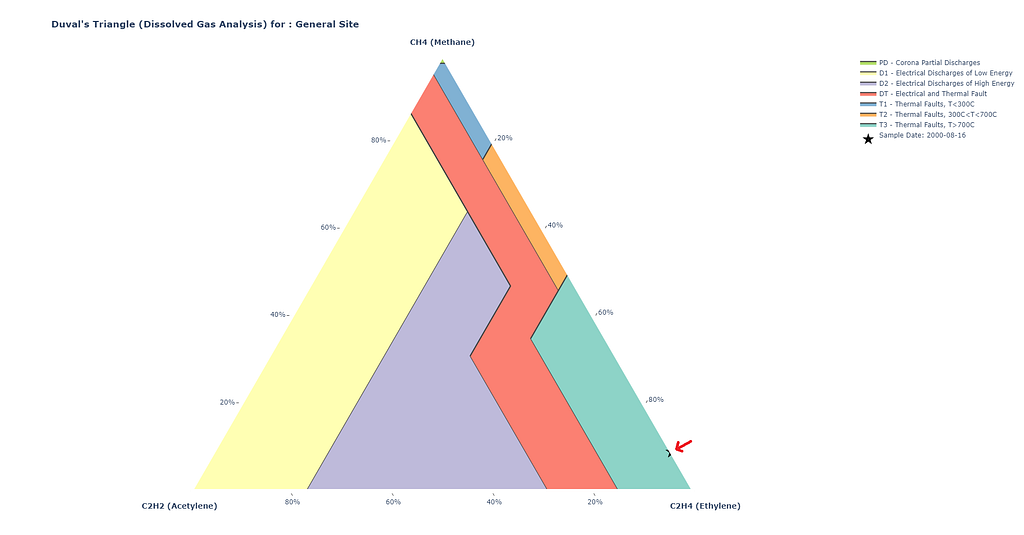
The concentrations of these gases, generated during transformer faults, indicate specific types of failures like partial discharge, thermal faults, and electrical arcing. By plotting the gas ratios on an equilateral triangle, Duval’s Triangle provides a clear and visual representation of fault zones.
About the Duval’s Triangle Plotter
The Duval’s Triangle Plotter is a Python script hosted on GitHub. It allows users to:
- Input gas concentration data.
- Automatically calculate gas ratios.
- Plot the ratios on Duval’s Triangle.
- Visualize fault zones with clear annotations and labels.
This tool is designed to be user-friendly, lightweight, and adaptable to different data sources. Whether you’re an engineer conducting field diagnostics or a researcher analyzing trends in transformer health, this tool streamlines the analysis process.
Key Features
- Accurate Visualization: Plots data points with precision on the triangle.
- Fault Identification: Clearly labels fault zones to help interpret results quickly.
- Customization: Flexible for different input formats and use cases.
- Open Source: Freely available for anyone to use and improve.
Getting Started
Prerequisites
To use the Duval’s Triangle Plotter, you’ll need:
- Python (3.7 or later)
- Required Python libraries: matplotlib, numpy
Installation
Clone the repository from GitHub:
git clone https://github.com/nagusubra/duvals_triangle_plotter.git
cd duvals_triangle_plotter
Install the dependencies:
pip install duvals-triangle-plotter==1.0Usage
Run the script and input your gas concentration data. For example:
import duvals_triangle_plotter as dtp

methane_points_list = [0.09] # units = ppm
acetylene_points_list = [0.0] # units = ppm
ethylene_points_list = [0.91] # units = ppm
date = "2000-08-16"

# Call the function to get Duval's Triangle traces
duval_trace = dtp.get_duval_points_traces(methane_points_list, acetylene_points_list, ethylene_points_list, date)

# Call the function to get Duval's Triangle plot
fig = dtp.get_duvals_triangle_plot([duval_trace], True)
The script will generate a Duval’s Triangle plot as an output image, showing the data points and corresponding fault zones.
Applications
- Preventative Maintenance: Regular analysis of gas concentrations helps in early detection of transformer faults.
- Research and Development: Analyze historical data to improve transformer designs.
- Training and Education: Teach transformer diagnostics using real-world examples.
Contributions
The project is open for contributions! If you’d like to add features, fix bugs, or improve documentation, feel free to fork the repository and submit a pull request. Let’s collaborate to make transformer diagnostics more accessible.
Future Plans
- Add support for additional diagnostic methods.
- Create a web-based interface for non-programmers.
- Integrate with IoT platforms for real-time diagnostics.
Conclusion
The Duval’s Triangle Plotter brings the power of data visualization to transformer diagnostics, making it easier to interpret and act on critical health data. Check out the GitHub repository to start using it today, and join the community to enhance this tool further.
Links
- PyPi link: https://pypi.org/project/duvals-triangle-plotter/
- GitHub Repository: Duval’s Triangle Plotter
Let’s simplify transformer diagnostics together!